Software editors
Give your customers the dashboards they deserve
Give your customers the dashboards they deserve
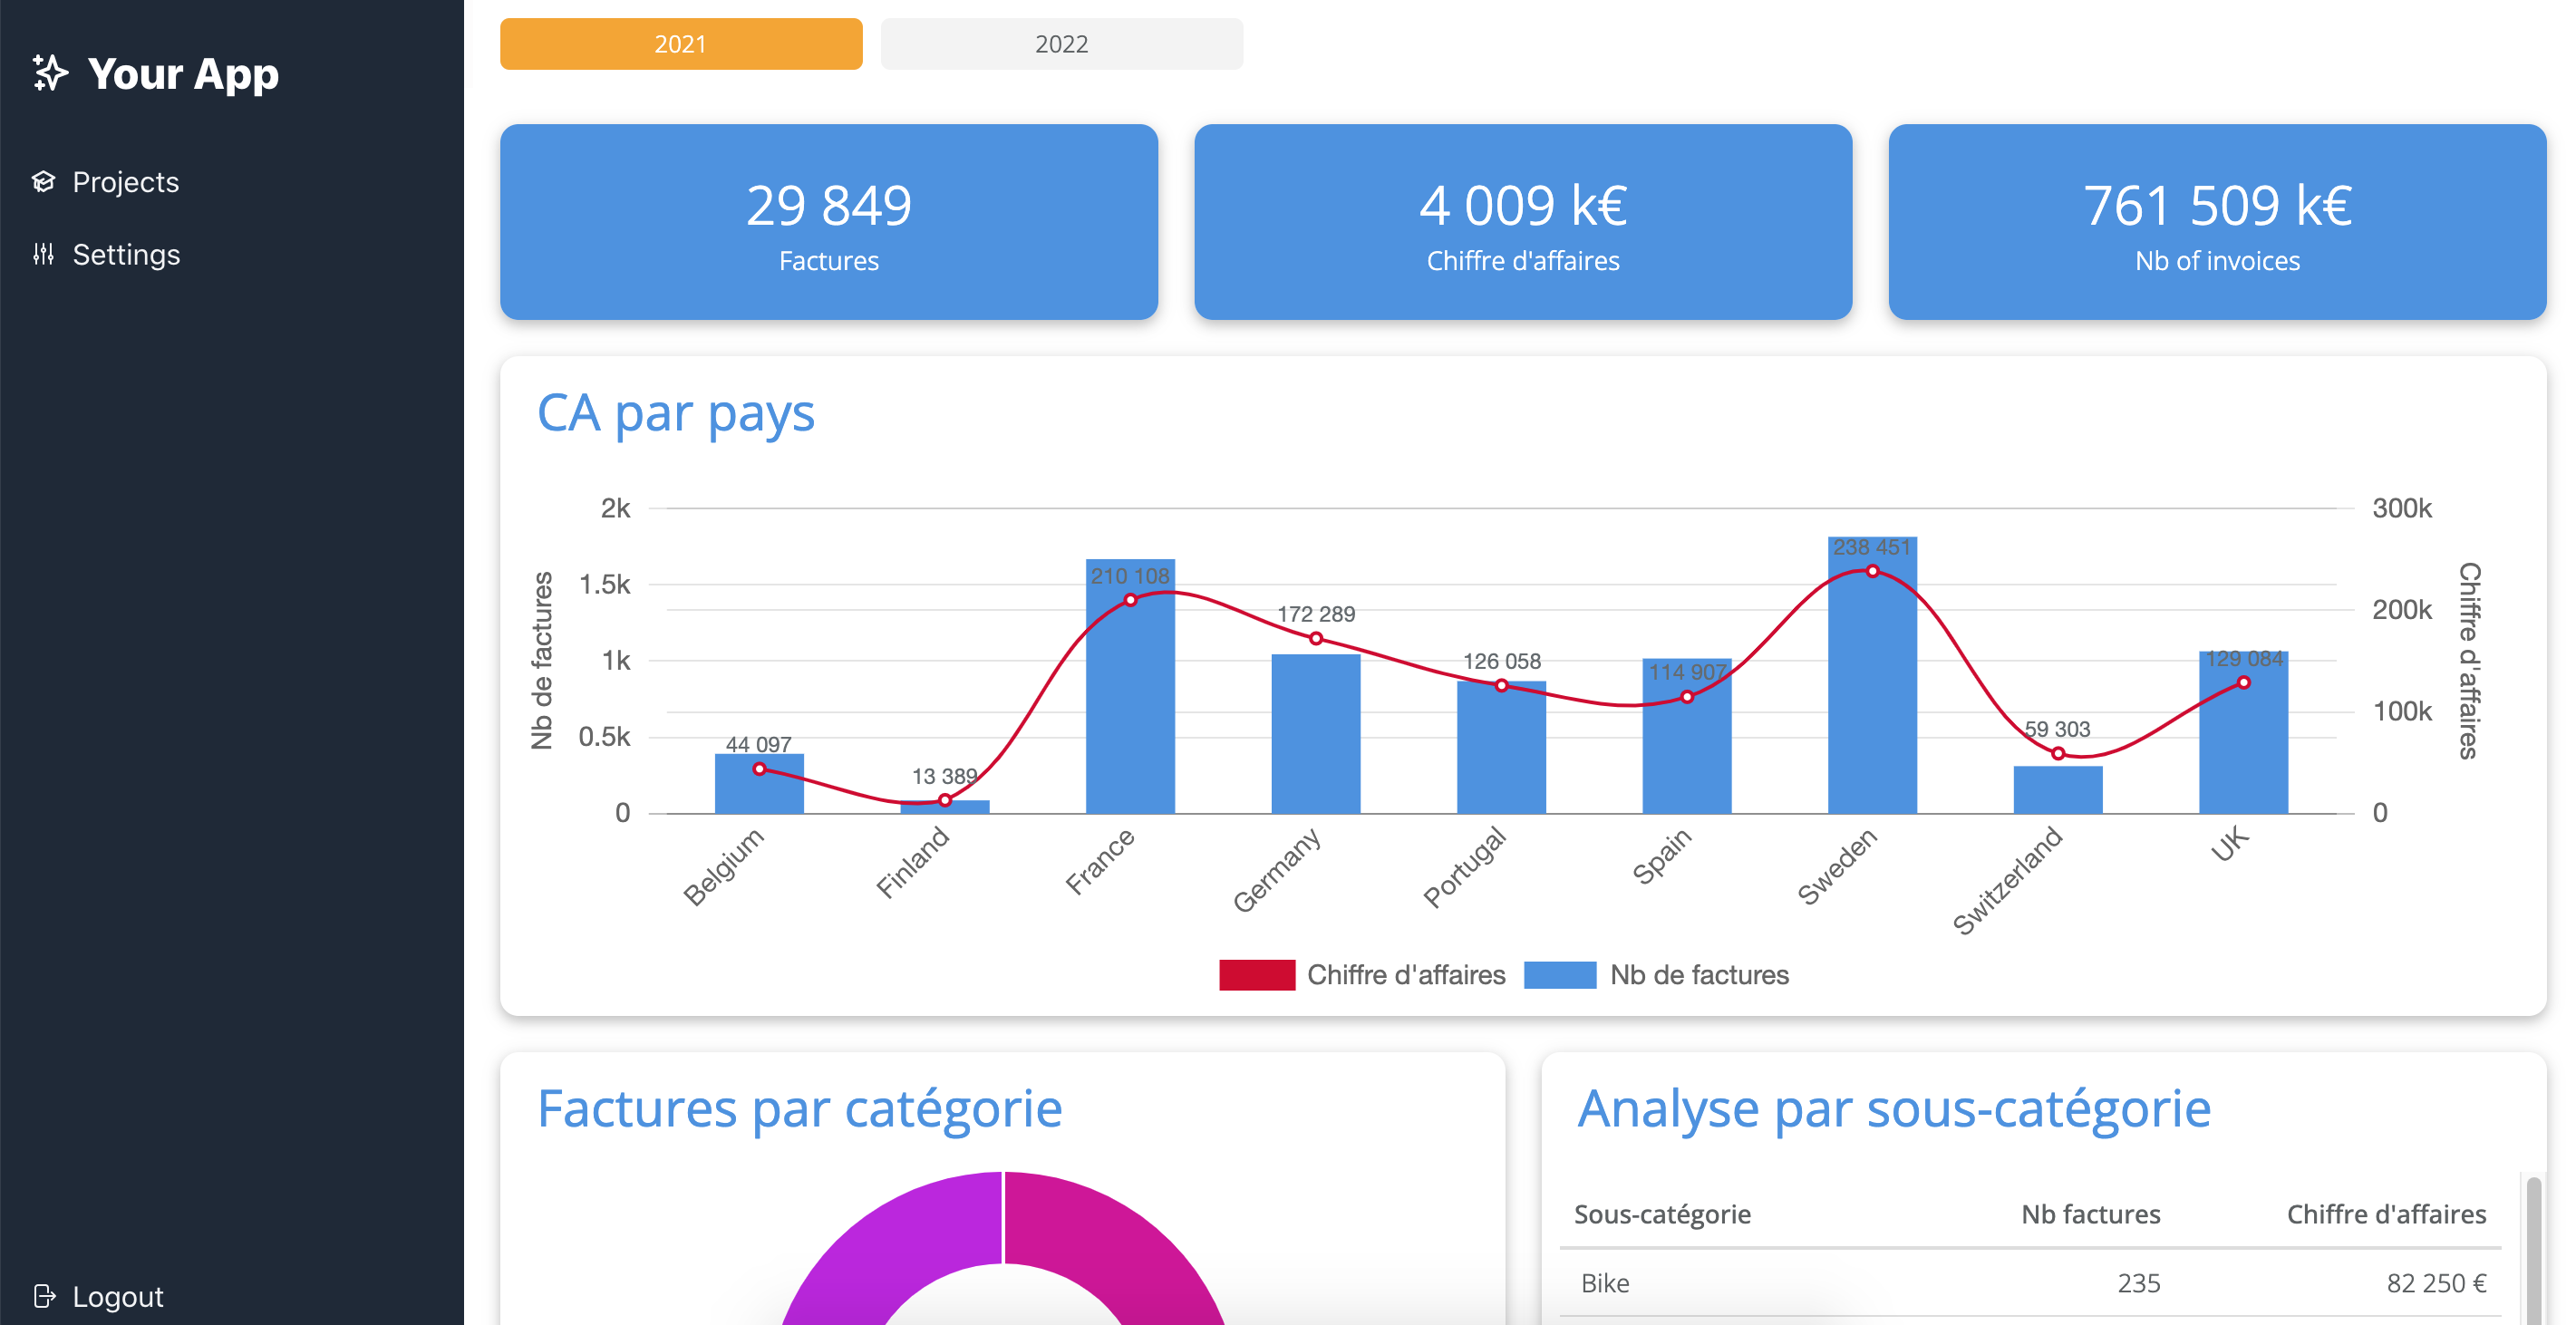
Embed interactive dashboards into your product with no effort.
Meet your customers' analytical needs quickly and easily.
Allow your project teams to build dashboards in complete autonomy without asking your developers.

The strengths for your application
- Attract more customers.
- Increase your customer retention.
- Generate upsell.
The benefits for your customer
- A centralized location: he accesses his dashboards directly in your application. He doesn't have to set up a complex technical stack to export data and connect an external BI tool.
- Ultra-customized dashboards dedicated to your customers' data and processes to make informed decisions, optimize your processes, improve productivity, reduce costs and be more profitable.
- An enhanced analytical experience : real-time updated dashboards, dynamic filters, interactions between the dashboards and your application, downloadable XLS or PDF exports or distributed by email, alarms on its data, these are all features that enrich the user experience.
- A simplified and facilitated approach to analytics, adopted by teams, which improves collaborative work and allows for greater efficiency and productivity.
How does it work?
- I connect the data of my application (in SQL or via a REST API) Read more
- I can upload other datasets (for example an Excel file provided by the customer).
- I can enrich the data by adding columns to the datasets without technical knowledge and independently, without having to call on my development team.
- I quickly design attractive dashboards with dynamic filters and choose from more than 35 graphic visualization elements (curves, histograms, tables ...) Read more
- In case of very advanced or custom needs, I am never stuck thanks to the LowCode engine integrated in Serenytics.
- I integrate the dashboards in my application in a transparent and secure way without any code line to create
- I finalize the design to have a "pixel-perfect" integration of my dashboard.
- I can completely redefine the CSS of the dashboards to obtain the exact design desired (Custom CSS).
- I can filter the content of a dashboard according to the user connected in my application, in a secure way, by dynamically passing parameters to the integrated dashboard to filter the data.
Video - how to embed a dashboard in your app

By integrating Serenytics in your application, you make analytics easy and accessible to all. You enrich your application with an agile solution and become a strategic partner for your customer in his decision making thanks to customized dashboards available in real time.
Serenytics is a powerful, fully configurable and scalable solution that adapts to your customers' specific needs as your application evolves.
×![]()