By Data-developer, we mean anyone who manipulates data and has coding skills (be it in Python, HTML, Javascript ...).
If this is your case, you will love all the possibilities offered by Serenytics.
Of course, for the majority of tasks, there is no need to code in our platform. Our interface allows you to go faster than having to write code.
But for specific needs, Serenytics has a low-code approach that allows you to get everything you want, in a minimum of lines of code, without any infrastructure to set up.

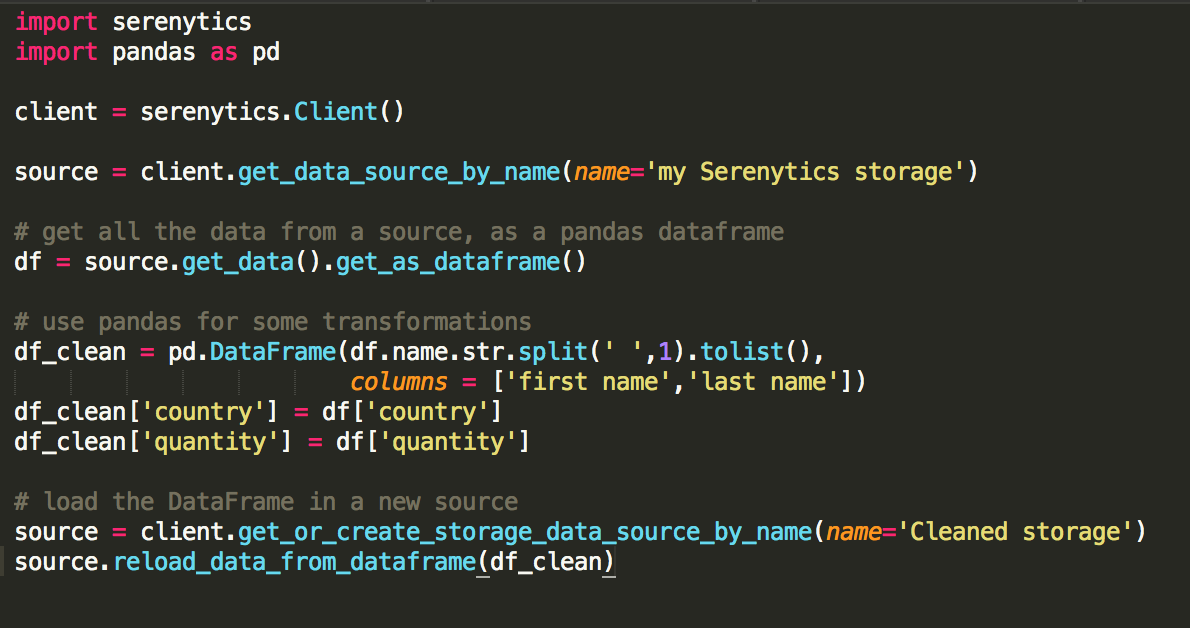
Our platform integrates a Python scripting system. Code all your data processing (import, export, advanced calculations, data cleaning, machine learning, predictive analyses ...) and execute them regularly via our scheduler or by triggering them via a REST API call. You avoid having to manage your own data processing infrastructure.
In a Python script, you can use the Serenytics package. This provides many functions that allow you to query a data source configured in the interface (with aggregates and filtering). The result of this query can be manipulated with the Python language, often using libraries like Pandas or Scikit-learn. And at the end of processing, the Serenytics library allows you to load your result into our internal Datawarehouse to view / share the results.
For testing and debugging, you can also run a script using the local Serenytics library in your favorite Python debugger. You can perform a processing and send the result to a storage Serenytics to visualize it or visually search the data interactively. This can also allow you to set up a processing in a Jupyter notebook before switching it to production on our platform.
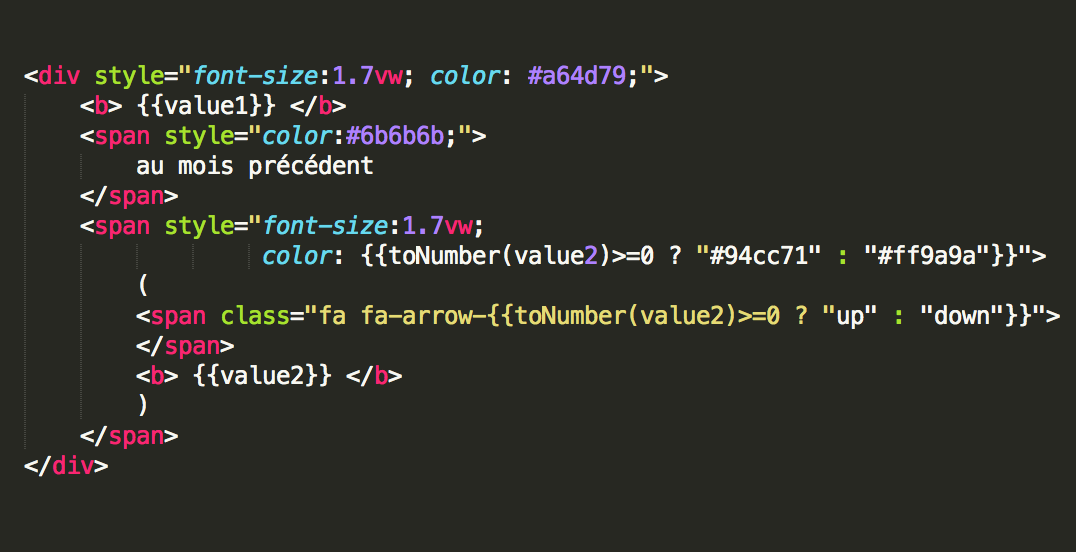
Often for graphic rendering issues, you want to write a widget to display one or more KPIs with a very particular design (for example, with a thumb icon up if a value exceeds a threshold, or downwards otherwise).
To do this, you can write directly into Serenytics the HTML code of your widget. In this code, you can retrieve data with the {{valueX}} syntax.
And all that is written between double accolade is passed to our interpreter. You can therefore display KPIs, but also modify a style according to the data, change the format of a date, limit the size of a string ... There are many possibilities.
This interpreter system is found in many places on our platform. For example, you can use it to adapt the contents of a cell in a table or to apply a calculation to a selected value in a dynamic filter before passing it to the data engine.


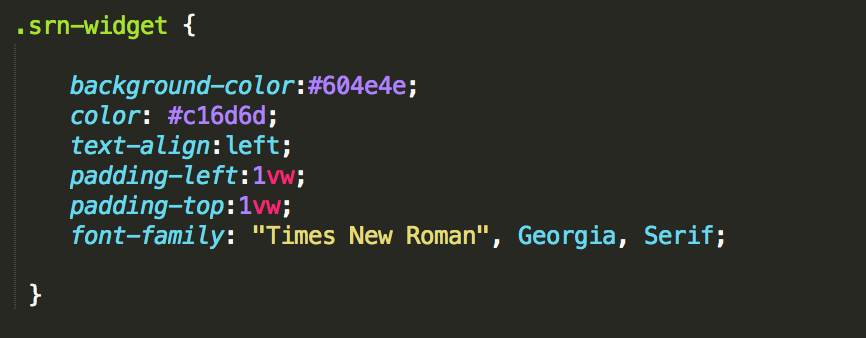
The CSS of your dashboard is completely editable. This gives you all the options to get exactly the design you want.
The header at the top of a dashboard can be written in HTML / CSS / JS. This opens up a lot of possibilities.
For example, you can create an advanced design with a logo. You can put icons that redirect the user from the dashboard to another dashboard or another application. You can also add Javascript code for example to trigger a reload of the data on a regular basis (e.g. every 10 minutes).


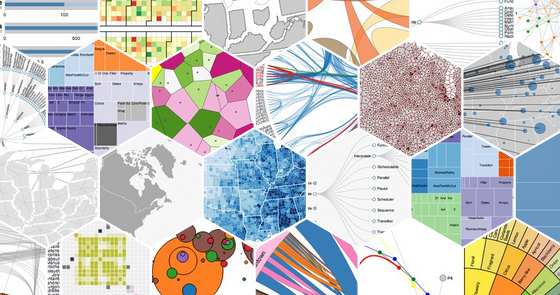
You can use our widget editor to integrate a full graphic widget, for example written in D3.js. Write your HTML / CSS / JS code directly in our studio. The data from our engine is accessible in the source code of your widget in JSON format. You just need to focus on the visualization part of your widget.
Our platform uses a backend / frontend web architecture with communication via REST API. You can also use this REST API provided by our backend.
For example, you can trigger the execution of a Python script with a simple API call (with passing parameters). You can also send message / event data to our datawarehouse.
In the majority of cases, we recommend using our Python client rather than the raw API, especially to benefit from the entire error handling layer. But if you have a need in another language, the API is available.

