Datavisualisation

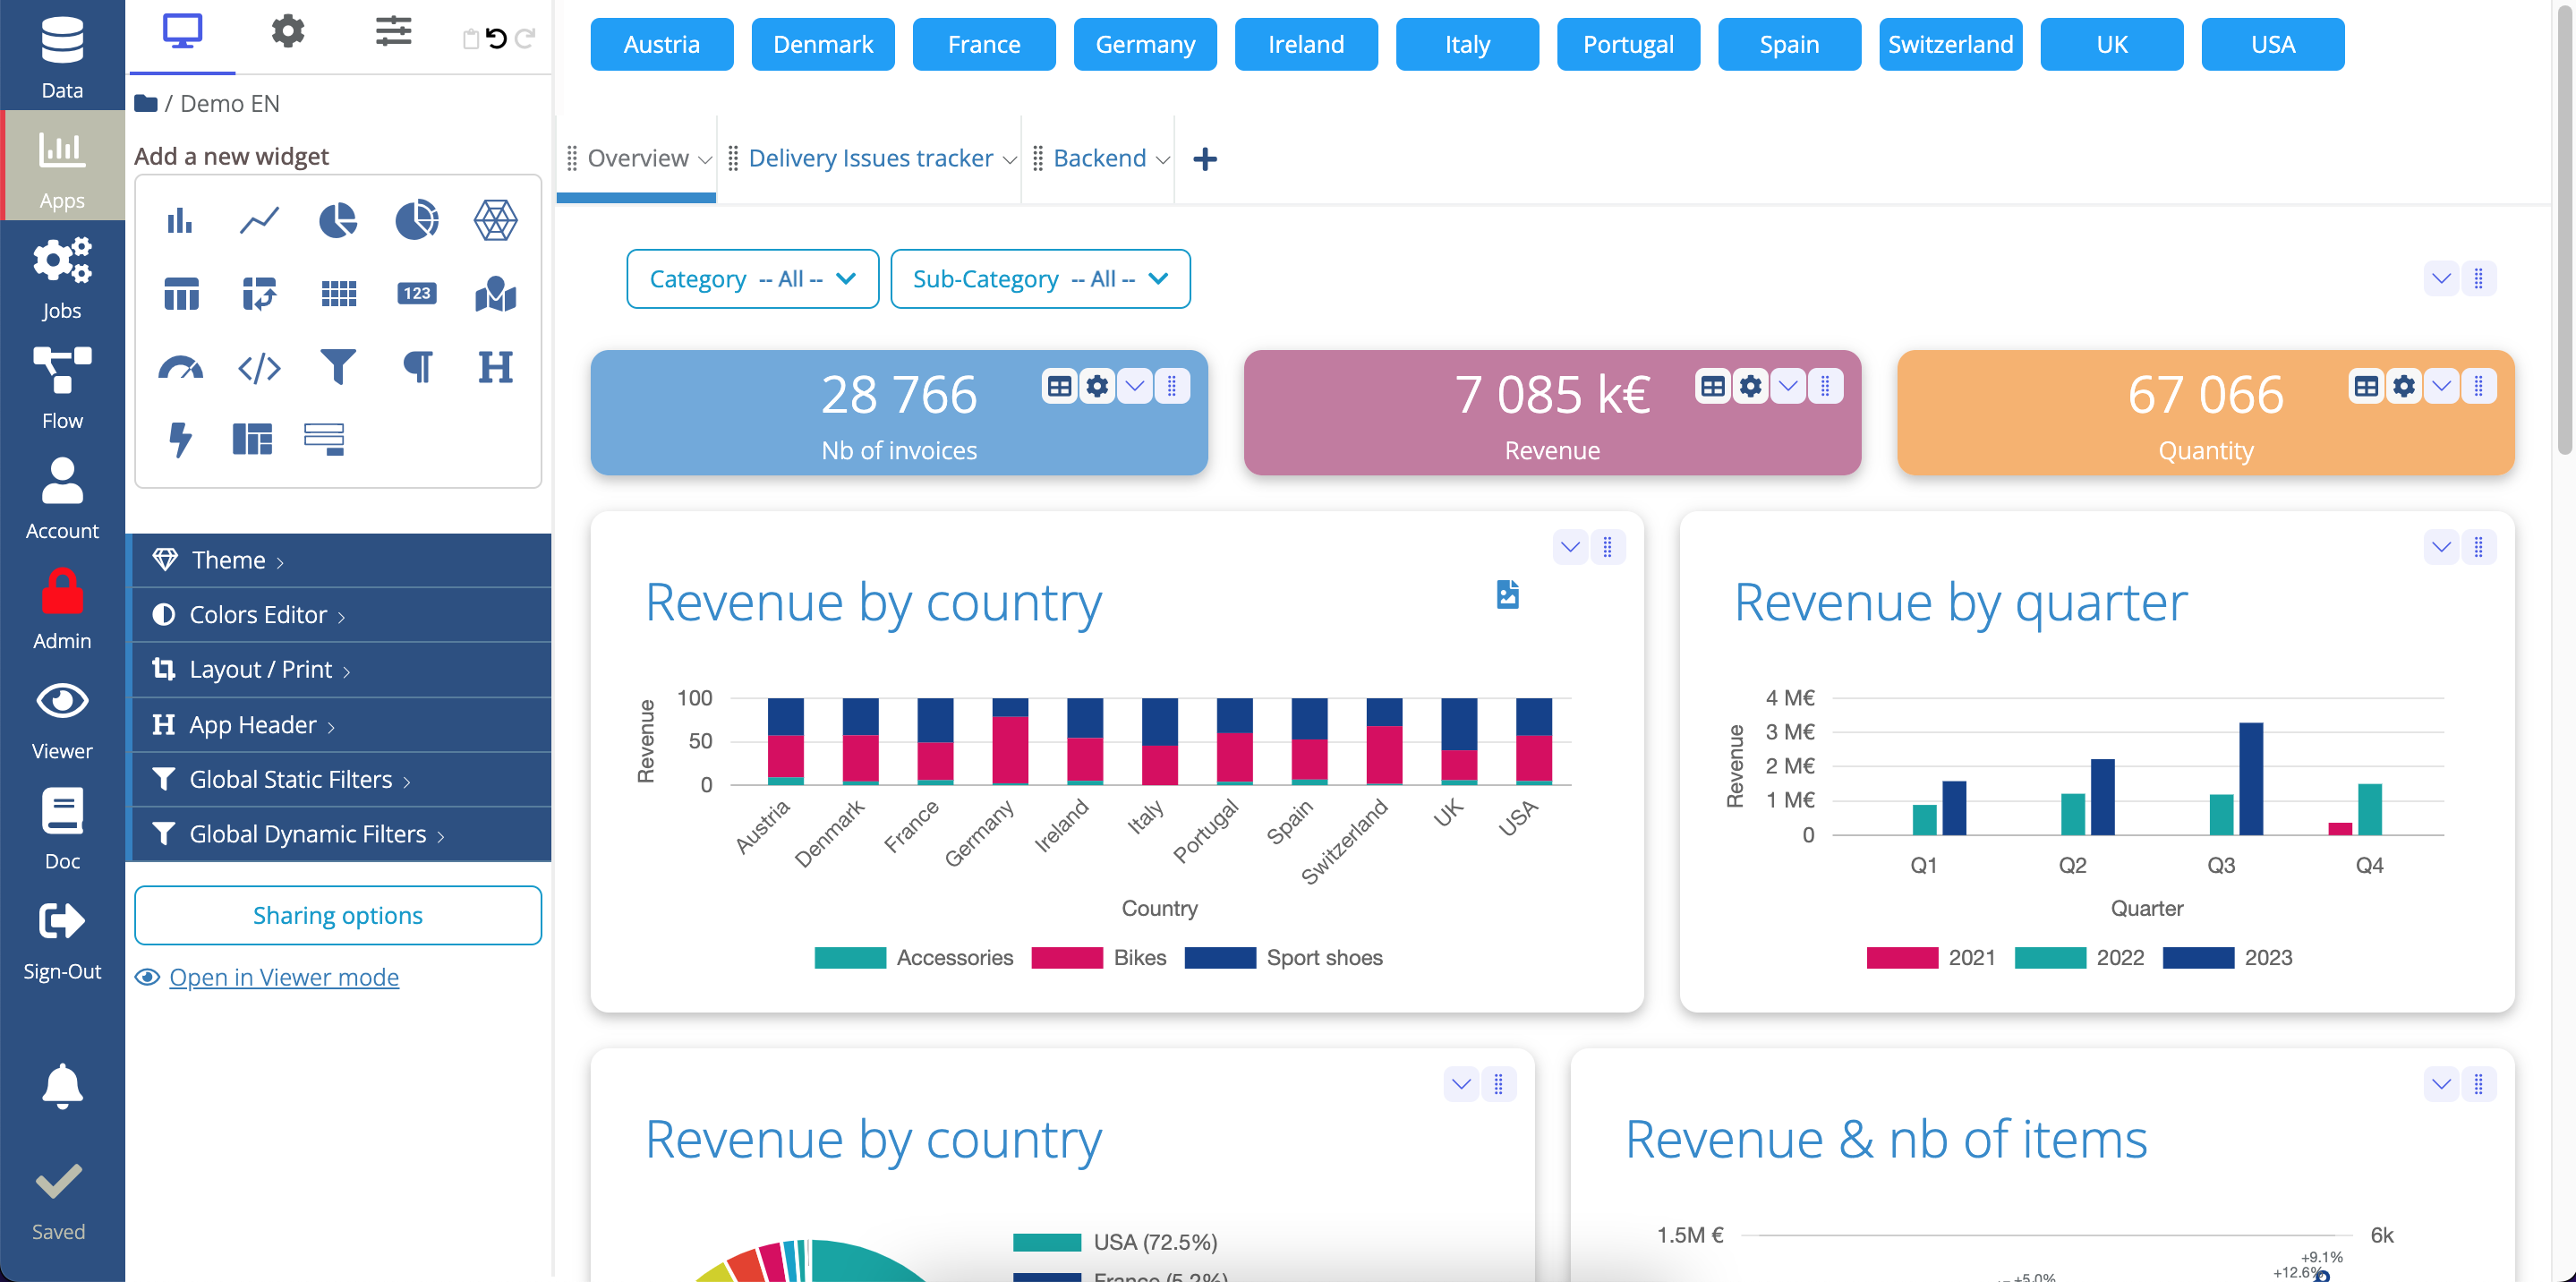
Create your dashboards with our interactive WYSIWYG Studio (What You See Is What You Get). Drag and drop components, add tabs, configure data queries...
The construction of a complete dashboard is done very simply without any technical skills.
Choose your widget in our library among KPIs, histograms, curves, simple arrays, pivot tables, pie-charts, ... Each one can be configured dynamically in our interface.


Build cell-by-cell arrays. Each cell can display a value from a different data source. You can also write computed formulas between the values of several cells. Setting up your main table of indicators is very easy with this component.
For each widget or for each dashboard, you can add filters that the Viewer can use. It lets him filter by date or by any column of your data. The addition of these filters is done by drag & drop, very easily.
For advanced use cases, you can write your customer filters in HTML with LowCode. You can also attach a variable and use it in your dashboards or in a datasources formula.

